


Railroad Commission of Texas
Our mission is to serve Texas by our stewardship of natural resources and the environment, our concern for personal and community safety, and our support of enhanced development and economic vitality for the benefit of Texans.
Emergency Management
Texas Energy on Track Podcast
RRC Awards
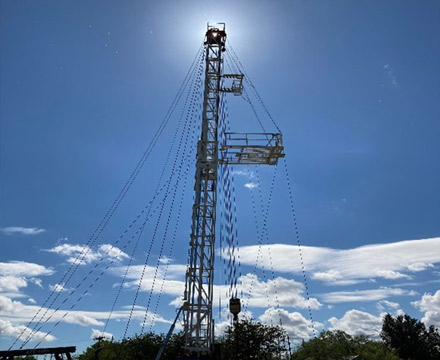
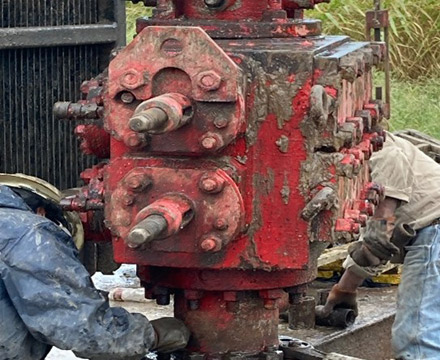
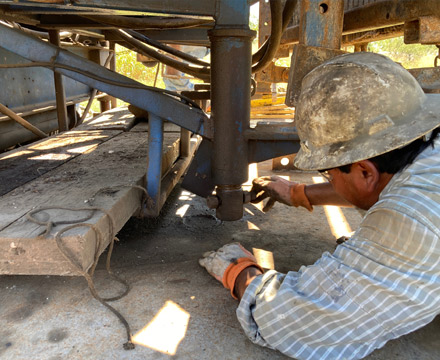
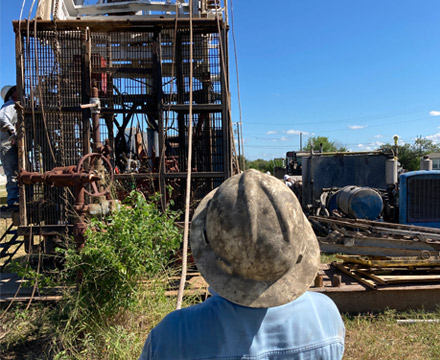
Work in the Field
Recent News
RRC Commissioners Assess More Than $1.4 Million in Penalties
AUSTIN – The Railroad Commission of Texas assessed $1,423,693 in enforcement docket fines against operators and businesses at the Commissioners’ open meeting on Thursday. The Commission has primary oversight and enforcement of the state’s oil and gas industry and intrastate pipeline safety.
Master Default Orders for operators that failed to appear at Commission enforcement proceedings can be found on the RRC Hearings Division web page.
Master Agreed Orders in which operators were ordered to come into compliance with Commission rules can be found on the RRC General Counsel web page.
Below is a summary table of fines assessed.
|
Fines Assessed in Master Default Orders |
$204,878 |
|
Fines Assessed in Master Agreed Orders |
$1,218,815 |
|
Total Fines Assessed |
$1,423,693 |
In the absence of timely motions for rehearing, decisions are final as stated in these final orders.
View All News